Equitable Parks, Sports, and Recreation
City of Bowie, Maryland


University of Maryland
Alexandra Veremeychik, John Quattrini, Charles Ritz, Selam Fesseha
Dr. Vanessa Frias-Martinez
AI Adoption Clinic: Values-Centered AI for Community Organizations
Spring 2026
College of Information Studies
May 6, 2026
Research Questions
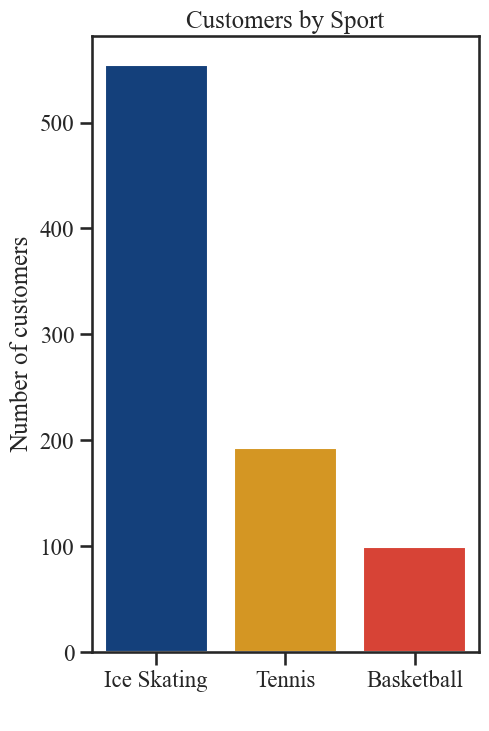
Who is participating in Bowie’s ice skating lesson programs, as well as ice skating, basketball, and tennis summer camps?
How does participation vary by geography, neighborhood demographics, and accessibility?
To what extent do participation patterns in City of Bowie recreation programs reflect equitable access across geographic, demographic, and socioeconomic groups, and what factors may shape differences in participation across program types?

Data
| Variables | Geography | Source |
|---|---|---|
| Customer #, Activity Name, Age, Difficulty | Individual | City of Bowie |
| Proportion White/Black/Latino/Asian | Census Block | 2020 US Census |
| Proportion below poverty line/in deep poverty/near poverty, Proportion Households without Vehicle | Census Block Group | 2024 American Community Survey 5-year Estimates |
| Proportion that Speak only English at Home | Census Tract | 2024 American Community Survey 5-year Estimates |
| Driving Distance and Estimated Travel Time (Driving) | Individual | City of Bowie and Open Source Routing Machine (OSRM) |

Participation Patterns - Learn to Skate and Skating Camps
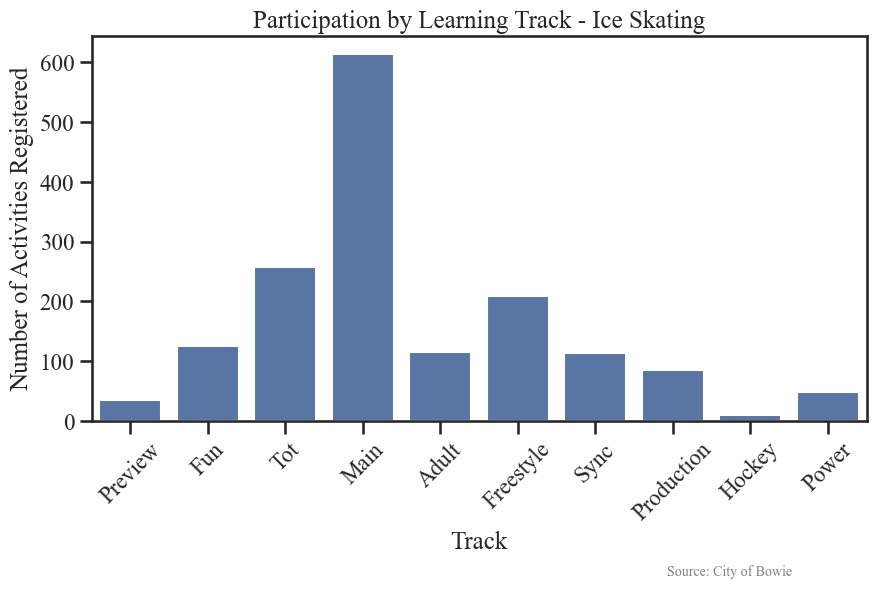
- Most Bowie Ice Arena group lesson customers are learning the basics of ice skating
- Freestyle skating is the most popular category for specialized skating
- Popularity varies by age category
- Main - most registrations
- 3-20 years old
- Tot - approximately half
- 2-5 years old
- Adult - fewest registrations
- 21 + years old
- Main - most registrations
Geographic Distribution of Participants
- Ice skating students come from Maryland, DC, and Virginia
- Basketball students represent Prince George's County, Calvert County, and Anne Arundel County
- Tennis students represent Prince George's County, Anne Arundel County, and Washington, DC
Geographic Distribution of Participants
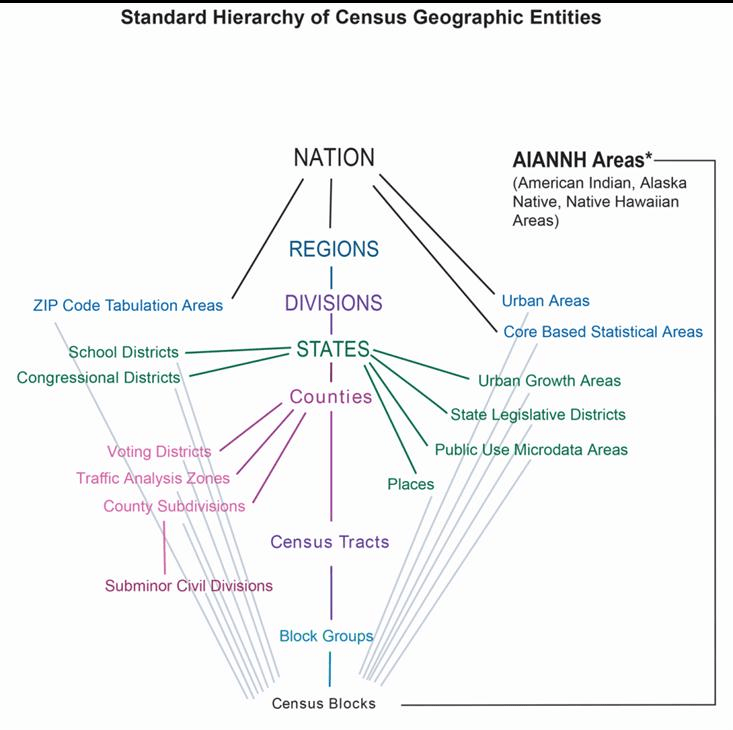
- Study looked at US Census Bureau geographies:
- Blocks
- Smallest
- Bound by visible features and property lines
- No population required
- Block groups
- Average 40-50 blocks
- Population 600-3000
- Tracts
- Relatively Homogeneous
- Population 1200-8000
- Blocks
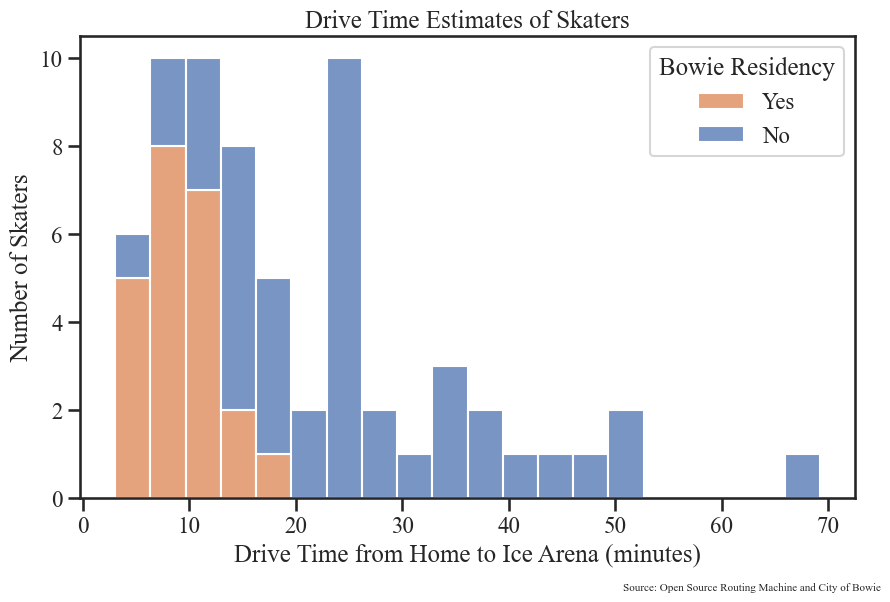
Accessibility and Travel Time
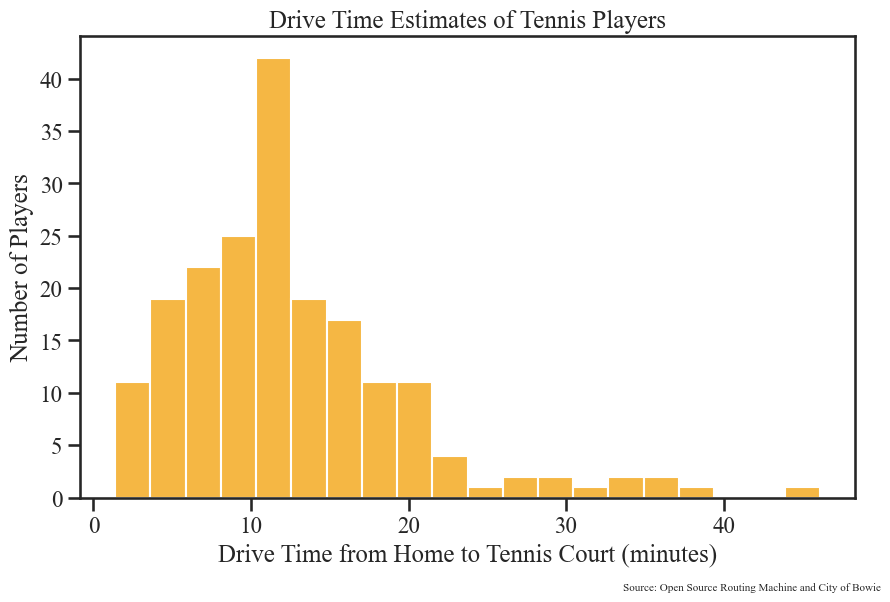
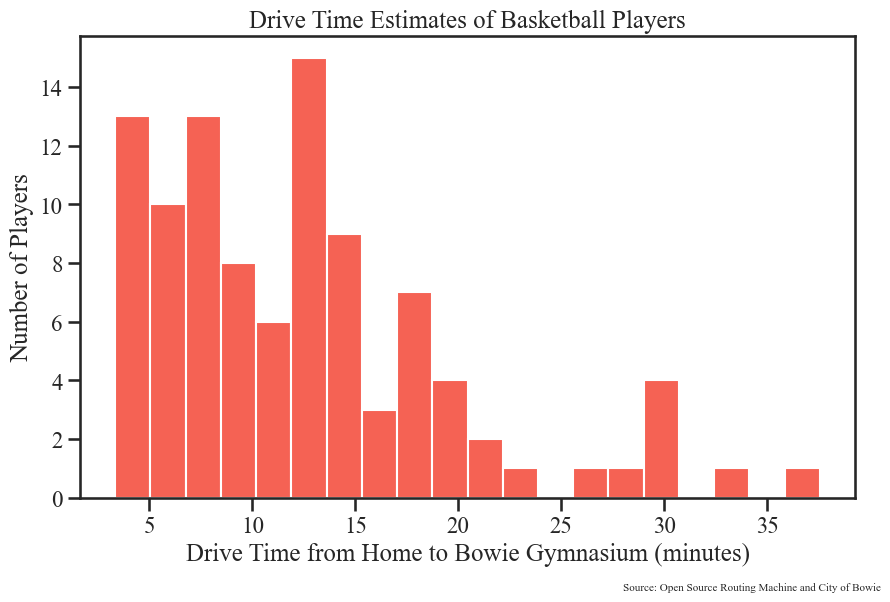
Accessibility and Travel Time
- Skaters are driving farther to Bowie Ice Arena
- Nearly 70% of ice skating class and summer camp participants reside outside of Bowie
Equity Analysis
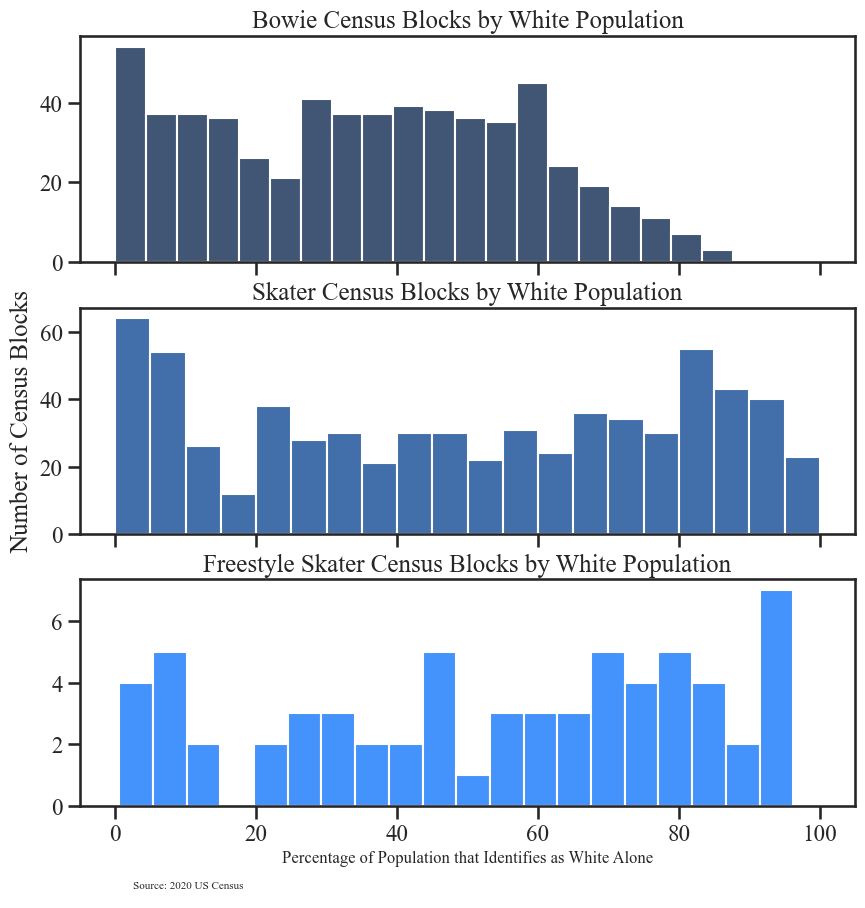
- Compared with Bowie overall, skater blocks appear more represented in higher White-alone percentage ranges, especially around 75%–90%
- Freestyle skater blocks shift toward more representation of blocks with majority white residents
- Smaller sample size means this pattern should be interpreted cautiously
- Similar patterns were seen with income
- Possible neighborhood-level demographic patterns in skating participation that may warrant further analysis
Equity Analysis
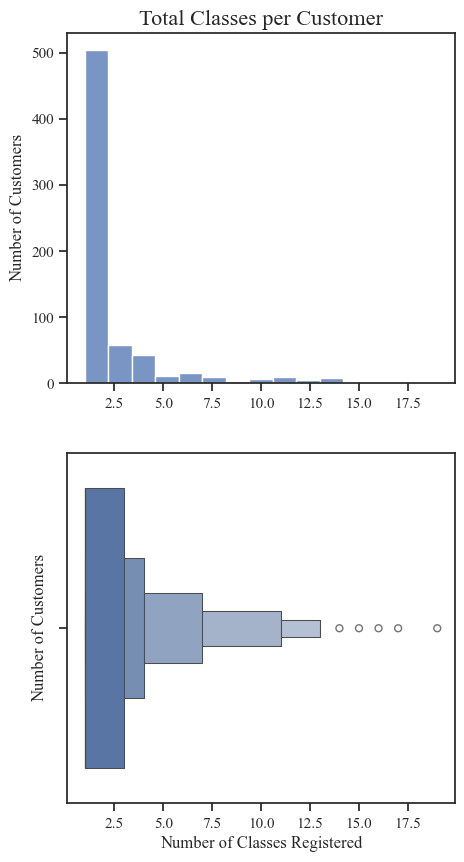
Customer Retention
- Measured retention through observed repeat registrations
- Used receipt numbers as a proxy for registration order
- Flagged registrations followed by a later registration from the same customer
- Created variables for prior engagement and total participation
- Most customers register for one or two activities within the study period
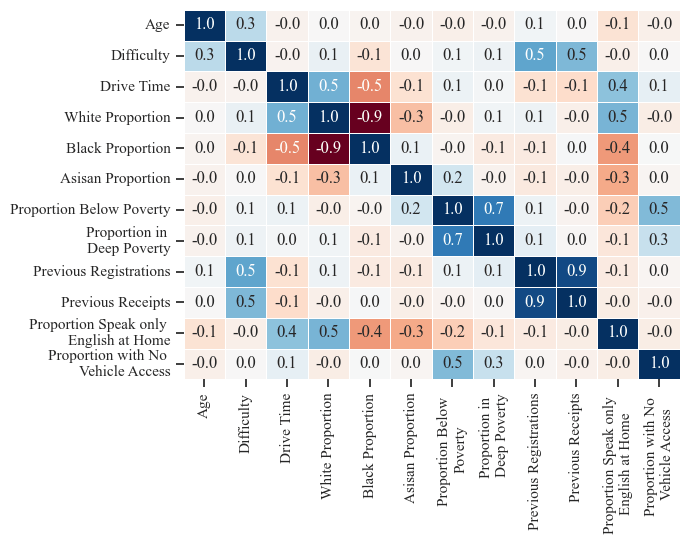
Model Exploration - Features
- Age
- Difficulty
- Travel time (driving)
- Racial composition of Census block
- Census block group socioeconomic measures
- Proportion of residents in deep poverty
- Proportion of residents below the poverty line
- Proportion of households without an available vehicle
- Census tract proportion who speak only English at home
- Number of previous activities registered
Model Exploration
- Categories:
- Customer will return for another skating activity
- Customer will not return for another skating activity
- Models tested:
- Decision Tree
- Accuracy: 67.9%
- Random Forest
- Accuracy: 75.4%
- Support Vector Machine
- Accuracy: 68.6%
- Decision Tree

Key Findings
- More data is needed to conduct robust statistical analysis
- Relationships between demographic, socioeconomic, and geographic factors may be non-linear or complex
- Despite many customers coming from outside of Bowie, travel time was one of the most important features
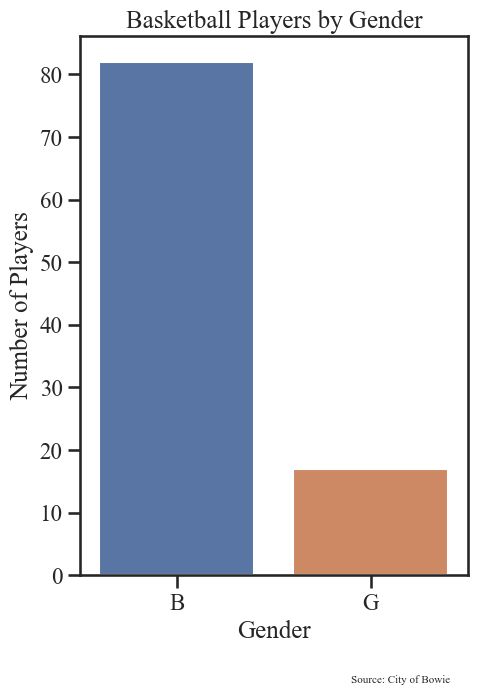
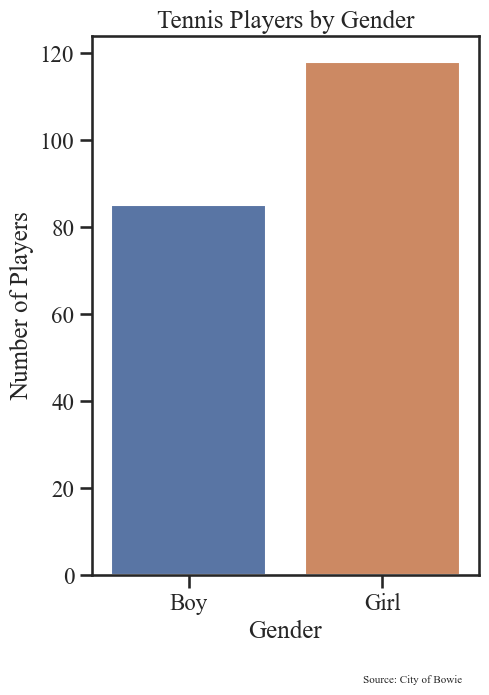
- Gender distributions vary between basketball and tennis camp participants
- Unknown for ice skating participants
Limitations
| Data Consistency | Sample Size | Timing and Retention | Neighborhood-Level Data | Accessibility Estimates |
|---|---|---|---|---|
| Program datasets vary in size, structure, and detail | Small datasets limit subgroup comparisons Modeling results may be unstable or sensitive to over-fitting | Records lack direct timestamps Receipt numbers were used as a proxy for registration order Records at the beginning and end may be improperly categorized | Census and ACS data describe areas, not individuals Results may change depending on the geographic unit used | Drive-time estimates do not capture traffic, transit, scheduling, etc. |
Recommendations
- Include timestamps in records
- Allows for better modeling
- Allows for temporal analysis
- Provide researchers with data from a wider range of dates
- More robust, varied analysis
- Capture voluntary socioeconomic data
- Race
- Gender (not included in ice arena data)
- Household income category (in ranges)
- Language spoken at home
- Collect data from other recreational activities
- Survey of recreational services users
- Include 15-digit Census GEOIDs with scrubbed data
Thank you!

Bowie Athlete Map
Special thank you to Peter Faragasso and the City of Bowie

Presentation & Report